Cigarette Smoking Among Adults - New York State 2000
Tobacco Use, Cessation, and Exposure to Second-Hand Smoke among New York State Adults: Behavioral Risk Factor Surveillance System
April, 2003
Produced by the New York State Department of Health, Bureau of Chronic Disease Epidemiology and Surveillance, Chronic Disease and Risk Factor Surveillance Unit in collaboration with the Tobacco Use Prevention and Control Program.
Executive Summary
The Behavioral Risk Factor Surveillance System (BRFSS) is the principal method of tracking tobacco use and tobacco-related behaviors in New York State's adult population. The survey has been conducted annually in the state since 1985, and knowledge gained from it is used to inform and guide the New York State Tobacco Control Program's (TCP) efforts to "reduce morbidity and mortality and alleviate the social and economic burden caused by tobacco use in New York State." The goals of the program are to (1) prevent the initiation of tobacco use among youth and young adults, (2) promote cessation from tobacco use, (3) eliminate exposure to second-hand smoke, (4) decrease the social acceptability of tobacco use, (5) build and maintain an effective tobacco control infrastructure, and (6) contribute to the science of tobacco control.
This report summarizes data pertaining to the use of tobacco products including cigarettes, cigars and smokeless tobacco for adults living in New York State, New York City and areas outside of New York City for 2000-2001. Other tobacco-related behaviors covered in this report include rates of cessation attempts and exposure to second-hand tobacco smoke. County-specific smoking prevalence rates are also provided here.
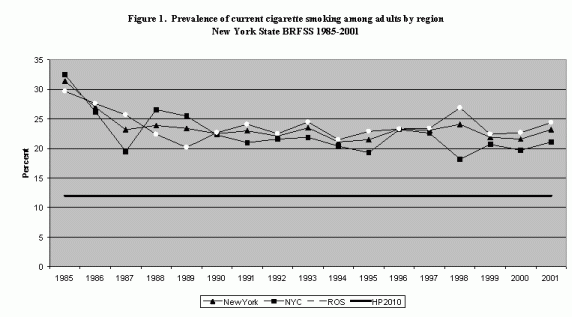
Current prevalence of adult smokers in New York State is 23.2% or approximately 3.3 million adults. Current smoking is defined as having smoked at least 100 cigarettes in a lifetime and currently smoking some days or every day. By that definition, nearly one in four New York State adults currently smokes cigarettes, a rate slightly lower than the median for the fifty states and Washington, DC. The overall prevalence of current smoking declined significantly in New York State between 1985 and 1990 but has remained essentially unchanged since. The prevalence of current smoking is lower in New York City compared with the rest of the state. New York State smokers tend to be younger, non-Hispanic white, and less educated.
Even though prevalence has remained unchanged since the early 1990s, significant shifts in smoking frequency have occurred. The proportion of current smokers who smoke some days (but not every day) has significantly increased since 1996. This suggests that smokers in New York State are smoking less frequently, an early indicator that tobacco control efforts are having their intended effect.
Promoting cessation is a primary goal of New York State's TCP. As such, information about the quitting behaviors of smokers is important to the state's efforts to reduce tobacco use. In 2001, about half of all current everyday smokers (1.2 million adults) quit smoking for one day or longer. This rate has remained essentially unchanged over the past six years. Of those who quit or tried to quit smoking in the past three years, only 30% reported having used cessation aids, such as counseling and pharmacotherapy, to assist their efforts at quitting. About 85% of current smokers recall having read or seen information about quitting smoking.
Most smokers and recent quitters were exposed to quit smoking information when watching television or obtained information from family, friends or on the radio. Some read about it in newspapers and magazines or received information while waiting at the doctor's office. This is an indication that TCP efforts to provide information through multiple outlets is succeeding.
Eliminating exposure to second-hand smoke is a goal of the TCP. Approximately 15% of non-smoking adults live in a household with a smoker. Nearly 60% of non-smoking adults, compared to 6% of adults who do smoke, do not allow smoking in the household. Among adults who work indoors most of the time, approximately 80% indicated their worksite does not allow smoking in either public or work areas. TCP efforts to eliminate exposure to second-hand smoke will continue to be an important priority in the future.
The US Department of Health and Human Services Healthy People initiative has set national targets related to tobacco use and other health related behaviors to be achieved by 2010. The Healthy People 2010 (HP2010) target for smoking prevalence is 12% compared with the state's year 2001 prevalence of 23.2%. The target for cessation attempts is 75% and New York State's current prevalence is 57%. New York is within range of the HP2010 targets for chewing tobacco (HP2010 target = 0.4%; NYS = 0.7%) and cigars (HP2010 target = 1.2%; NYS = 1.8%).
Healthy People 2010 targets for smoking prevalence and cessation attempts suggest that New York State must redouble its efforts to reduce tobacco use. Activities of New York State's TCP include local community programs that enhance partnerships with local organizations, conduct educational programs for community and business leaders, health care providers, school personnel and others; promotion and enhancement of cessation opportunities to support and motivate smokers to quit; and media campaigns to increase awareness about the dangers of exposure to second-hand smoke, change population attitudes about tobacco use, and expose the marketing tactics of the tobacco industry.
Interventions proven to effectively reduce prevalence, increase cessation attempts, and reduce exposure to second-hand smoke include: smoking bans and restrictions; increasing the unit cost for tobacco products; mass media campaigns when combined with other interventions; provider reminder systems and provider education to promote cessation and; patient telephone support for cessation when combined with other interventions.
Monitoring tobacco use, related behaviors and attitudes provides information on TCP progress toward achieving program goals and objectives. Public health programs rely on data from the BRFSS and other health surveillance systems to examine behaviors, attitudes and health outcomes at regular time intervals allowing observation of trends, determination of priority health issues and identification of populations at highest risk. Implementation of effective program interventions combined with continuous surveillance and evaluation provide a roadmap for improving the public's health.
Introduction
Tobacco use is the leading cause of preventable death and disease in the United States. Most tobacco users begin using tobacco in early adolescence,; and almost all first-use occurs before age 18. In 1999, tobacco use caused more than 24,500 deaths in New York State with 13.7 years of potential life lost for each death on average due to smoking.1 Medical costs due to smoking were more than $6.4 billion dollars for New York State in 1999.
This report summarizes use of tobacco products including cigarettes, cigars and smokeless tobacco, cessation and exposure to second-hand tobacco smoke for adults in New York State, New York City, areas outside of New York City referred to as the rest of the state, and by county.
The data for this report are from the Behavioral Risk Factor Surveillance System (BRFSS), an annual random-digit dialing (RDD) telephone survey of New York State non-institutionalized adults aged 18 years and older. The BRFSS was designed by the Centers for Disease Control and Prevention (CDC) and is implemented by the New York State Department of Health to collect and report information on behavioral risk factors for chronic diseases and conditions and the use of preventive health services related to the leading causes of morbidity and mortality in the population. 2
Information gathered from the BRFSS is used to inform and guide the New York State TCP's efforts to "reduce disease, disability, and death related to tobacco use." 3
Definitions
Current cigarette smokers are those who have smoked at least 100 cigarettes in a lifetime and currently smoke everyday or some days. This definition has been modified over time since the first New York State BRFSS survey in 1985 (Table 1). For consistency, tTrends in prevalence of current smokers are reported using the most recent definition for 1996-2001 and the closest similar definition for prior years.
| Year | Definition |
|---|---|
| 1985-1993 |
|
| 1994-1995 |
|
| 1996-2001 |
|
Someday smokers are those who have smoked at least 100 cigarettes in their lifetime and now smoke cigarettes some days, not every day.
Ever users of smokeless tobacco products are those who ever used or tried any smokeless tobacco product such as chewing tobacco, snuff or both. Current users of smokeless tobacco products are those who currently (both daily and occasionally) use chewing tobacco, snuff or both.
Ever cigar smokers are those who ever smoked a cigar, even just a few puffs. Current cigar smokers are those who have smoked a cigar every day, several times per week or once per week within the past month.
A smoking cessation attempt occurs when a current smoker stops smoking for 1 day or longer in the previous 12 months in an attempt to quit smoking. Recent quitters are previous everyday or some day smokers who have quit smoking completely within the past 3 years.
Methodology
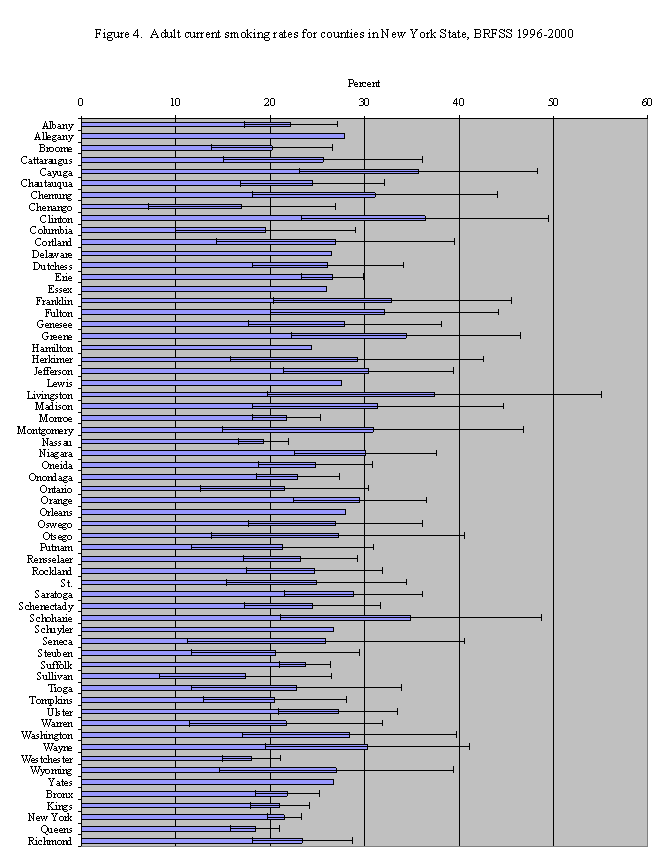
County-specific prevalence estimates of current smoking by adults were calculated using BRFSS data from 1996 through 2000. Sufficient data were available to calculate county-level estimates of current smoking among adults for 54 of the 62 counties in New York State. Smoking prevalence for the remaining counties was estimated using statistical techniques. 4
Software for Statistical Analysis of Correlated Data (SUDAAN), an application designed for the analysis of complex surveys, was used to compute 95% confidence intervals, linear contrasts and to conduct statistical tests.5 The 95% confidence interval defines the range within which the true population prevalence lies with 95% probability. Confidence intervals are provided in the tables and are represented by vertical lines in the figures.
For the majority of comparisons, t-tests were conducted to determine if differences in estimates were significant at p<0.05, that is, the likelihood of a difference being detected when it does not exist is less than five percent. Results of significance tests are noted in the tables and all differences cited in this report meet this criterion. Linear contrasts were used to test tobacco use trends from time periods of 1985-2001, 1985-1990, and 1990-2001.
For state comparisons with the national data, non-overlapping confidence intervals were used to indicate significant differences. This more conservative measure was used in the absence of the data set for the national sample.
Prevalence of Tobacco Use
Cigarettes
The Healthy People 2010 national target for adult tobacco use is 12%.6 The prevalence of current cigarette smoking among New York State adults in 2001 was 23.2% compared to the national median of 22.9%.7 The prevalence of current adult smokers in New York City was 21.1% compared to 24.4% in the rest of the state.
The 2001 rate of cigarette smoking in New York State for men is 26.1% and for women, 20.7%. Smokers are more likely to be young, non-Hispanic white and less educated (Table 2).
The 2001 statewide prevalence of cigarette use represents more than twenty-five percent decline in the percentage of adult smokers when compared with the 31.4% smoking rate in 1985 (table2), the first year that annual BRFSS data were available in New York State. The New York City area demonstrated a decline of 35% in current adult cigarette smokers from 32.5% in 1985 to 21.1% in 2001. The prevalence of current adult smokers in the rest of the state declined by 18% from 1985 to 2001 (29.7% to 24.4%). Cigarette use declined significantly from 1985 to 1990 in New York State, New York City, and the rest of the state, (p<0.01) and then stabilized from 1990 to 2001.
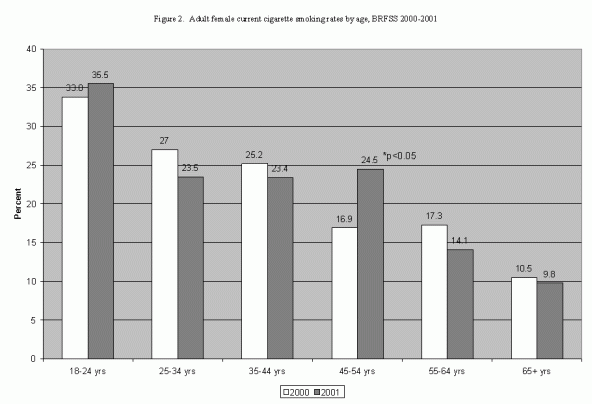
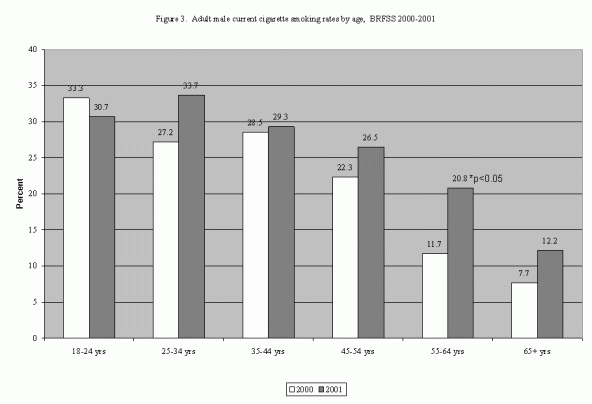
Comparing smoking rates for 2000 (Table 3) and 2001, prevalence of current smoking in New York State was 21.6% and 23.2%, respectively. In New York City the rates were 19.7% and 21.1%, and in the rest of the state the smoking rates were 22.7% and 24.4% for 2000 and 2001, respectively. None of these differences in rates reached statistical significance. Smoking among men (22.6% in 2000 and 26.1% in 2001) and smoking among women (20.7% for both years) did not change. Comparing prevalence by age from 2000 to 2001, adults aged 18-24 years consistently have the highest rates of smoking. Prevalence of smoking among females aged 45-54 years increased significantly from 16.9% in 2000 to 24.5% in 2001, prevalence of smoking among males aged 55-64 years increased significantly from 11.7% in 2000 to 20.8% in 2001 (Figures 2-3).
New York State ranks 27th nationwide for the highest prevalence of current smokers.8 County-specific smoking prevalence rates ranged from 17.1% (Chenango County) to 40.1% (Cortland County) (Figure 4).
| New York State | New York City | Rest of State | ||||||||
|---|---|---|---|---|---|---|---|---|---|---|
| n | % | C.I.* | n | % | C.I.* | n | % | C.I.* | ||
| Total | 3882 | 23.2 | 21.6-24.8 | 1314 | 21.1 | 18.5-23.7 | 2568 | 24.4 | 22.4-26.4 | |
| Gender | Male | 1607 | 26.1 | 23.6-28.6 | 543 | 23.5 | 19.3-27.6 | 1064 | 27.5 | 24.4-30.6 |
| Female | 2275 | 20.7 | 18.7-22.7 | 771 | 18.8 | 15.7-21.9 | 1504 | 21.7 | 19.1-24.3 | |
| Age (yrs.) | 18-24 | 317 | 33.0 | 26.7-29.3 | 121 | 29.4 | 20.5-38.3 | 196 | 35.0 | 26.7-43.3 |
| 25-34 | 796 | 28.7 | 25.0-32.4 | 352 | 23.9 | 18.5-29.3 | 444 | 32.6 | 27.7-37.5 | |
| 35-44 | 874 | 26.3 | 22.8-29.8 | 285 | 21.0 | 15.1-26.9 | 589 | 29.1 | 24.8-43.4 | |
| 45-54 | 748 | 25.5 | 22.0-29.0 | 229 | 22.7 | 16.2-29.2 | 519 | 27.0 | 22.7-31.3 | |
| 55-64 | 480 | 17.2 | 13.3-21.1 | 150 | 18.5 | 11.6-25.4 | 330 | 16.6 | 11.9-21.3 | |
| 65+ | 596 | 10.8 | 8.1-13.5 | 149 | 11.1 | 5.6-16.6 | 447 | 10.6 | 7.5-13.7 | |
| Race/Ethnicity | White,Non-Hispanic | 2761 | 24.9 | 23.0-26.5 | 579 | 25.5 | 21.3-29.7 | 2182 | 24.8 | 22.7-26.9 |
| Black,Non-Hispanic | 361 | 17.9 | 13.4-22.4 | 240 | 16.4 | 11.2-21.6 | 121 | 20.8 | 12.2-29.4 | |
| Hispanic | 478 | 21.9 | 17.5-26.3 | 340 | 21.6 | 16.5-26.7 | 138 | 22.4 | 14.2-30.6 | |
| Other | 224 | 21.4 | 15.1-27.7 | 126 | 16.6 | 9.3-24.0 | 98 | 27.5 | 17.0-37.9 | |
| Education | < High School | 383 | 29.7 | 24.2-35.2 | 193 | 23.1 | 16.2-27.0 | 190 | 37.3 | 29.1-45.5 |
| High School | 1052 | 27.9 | 24.9-30.9 | 296 | 21.1 | 15.9-26.3 | 756 | 31.0 | 27.3-34.7 | |
| Some College | 1004 | 25.3 | 22.0-28.6 | 281 | 21.1 | 15.7-26.5 | 723 | 27.2 | 23.1-31.1 | |
| College Grad+ | 1431 | 14.8 | 12.7-16.9 | 540 | 19.7 | 15.6-23.8 | 891 | 12.1 | 9.7-14.5 | |
* 95% Confidence Interval
** Information not reported due to sample size <50
| New York State | New York City | Rest of State | ||||||||
|---|---|---|---|---|---|---|---|---|---|---|
| n | Percent | ± C.I.* | n | Percent | ±C.I.* | n | Percent | ±C.I.* | ||
| Total | 3347 | 21.6 | 1.6 | 1171 | 19.7 | 2.7 | 2176 | 22.7 | 2.0 | |
| Gender | Male | 1330 | 22.6 | 2.6 | 444 | 21.9 | 4.6 | 886 | 23.0 | 3.1 |
| Female | 2017 | 20.7 | 2.0 | 727 | 17.8 | 3.1 | 1290 | 22.4 | 2.6 | |
| Age (yrs.) | 18-24 | 295 | 33.0 | 6.0 | 119 | 24.1 | 8.7 | 176 | 39.2 | 7.8 |
| 25-34 | 684 | 27.1 | 3.8 | 287 | 27.7 | 6.1 | 397 | 26.7 | 4.8 | |
| 35-44 | 820 | 26.8 | 3.5 | 265 | 21.7 | 5.7 | 555 | 29.5 | 4.3 | |
| 45-54 | 579 | 19.5 | 4.2 | 186 | 17.1 | 7.5 | 393 | 20.8 | 5.0 | |
| 55-64 | 392 | 14.7 | 3.8 | 130 | 13.3 | 6.7 | 262 | 15.5 | 4.5 | |
| 65+ | 533 | 9.4 | 2.6 | 167 | 10.8 | 5.1 | 366 | 8.7 | 3.0 | |
| Race/ Ethnicity |
White, Non-Hispanic | 2380 | 22.6 | 1.9 | 519 | 21.1 | 4.2 | 1861 | 23.0 | 2.1 |
| Black, Non-Hispanic | 386 | 21.6 | 5.1 | 267 | 20.2 | 6.0 | 119 | 25.1 | 9.6 | |
| Hispanic | 366 | 18.1 | 4.4 | 256 | 18.9 | 5.2 | 110 | 16.3 | 8.0 | |
| Other | 151 | 20.4 | 7.4 | 103 | 17.5 | 8.5 | ** | ** | ** | |
| Education | < High School | 325 | 23.9 | 5.1 | 149 | 17.7 | 6.5 | 176 | 29.7 | 7.7 |
| High School | 915 | 26.6 | 3.3 | 308 | 23.1 | 5.4 | 607 | 28.6 | 4.1 | |
| Some College | 898 | 23.7 | 3.3 | 269 | 22.3 | 6.4 | 629 | 24.5 | 3.8 | |
| College Grad+ | 1196 | 14.2 | 2.3 | 439 | 15.5 | 3.8 | 757 | 13.5 | 2.8 | |
*95% Confidence Interval
** Information not reported due to sample size <50
Statistically significant changes were observed in daily use of cigarettes over time. The proportion of smokers who smoke daily decreased from 19.2% in 1996 to 16.6% in 2001, while the proportion of smokers who only report smoking on some days has increased from 4.0% to 6.6% (Table 4).
| Year | Current Smokers (%) | Everyday Smokers (%) | Someday Smokers (%) |
|---|---|---|---|
| 1996 | 23.3 | 19.2 | 4.0 |
| 1997 | 23.1 | 19.1 | 4.0 |
| 1998 | 24.1 | 18.4 | 5.7 |
| 1999 | 21.8 | 17.0 | 4.8 |
| 2000 | 21.6 | 15.9 | 5.7 |
| 2001 | 23.2 | 16.6 | 6.6 |
Smokeless Tobacco and Cigars
The prevalence of ever-using smokeless tobacco products such as chewing tobacco or snuff in 1999 was 7.6% for New York State, 3.3% in New York City and 9.9% in the rest of the state. Current use of smokeless tobacco was 0.7% in New York State, 1.0% in New York City, and 0.3% in the rest of the state (Table 5).
The prevalence of cigar use was measured in the 1998 BRFSS. The rate of those who ever used cigars was 33.4% in New York State, 26.6% in New York City, and 36.7% in the rest of the state. Current use of cigars was 1.8% in New York State, 2.1% in New York City and 1.6% in the rest of state (Table 5).
| New York State | New York City | Rest of State | |||||||
|---|---|---|---|---|---|---|---|---|---|
| n | % | C.I.* | n | % | C.I.* | n | % | C.I.* | |
| Ever used smokeless tobacco product | 2,503 | 7.6 | 6.4-8.8 | 882 | 3.3 | 2.1-4.5 | 1,621 | 9.9 | 8.2-11.6 |
| Currently use smokeless tobacco product | 2,650 | 0.7 | 0.3-1.1 | 947 | 1.0 | 0.5-1.5 | 1,703 | 0.3 | 0.3-0.6 |
| Ever smoked cigars | 2,527 | 33.4 | 31.2-35.6 | 863 | 26.6 | 23.1-30.1 | 1,664 | 36.7 | 34.0-38.7 |
| Currently smoke cigars | 2,527 | 1.8 | 1.2-2.4 | 863 | 2.1 | 0.9-3.3 | 1,664 | 1.6 | 0.9-2.3 |
* 95% Confidence Interval
Cessation
A national Healthy People 2010 objective is to increase quit attempts among adult smokers, such that 75% attempt to stop smoking each year. Effective strategies to help people quit smoking include policy changes that increase the price of cigarettes, clean indoor air laws that make smoking inconvenient, and health care systems that track patient tobacco use and prompt health care providers to provide advice and assistance to stop using tobacco.9
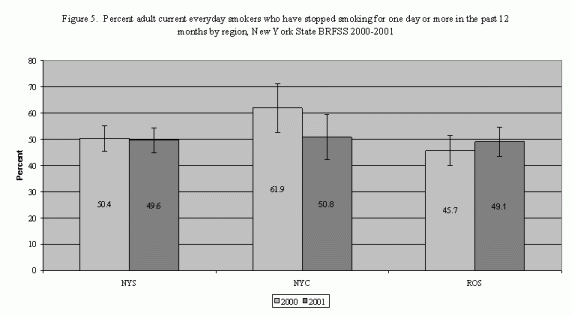
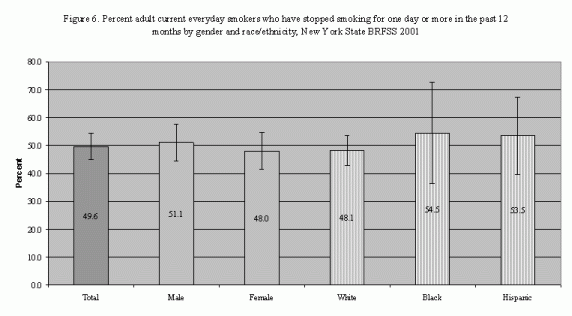
Approximately half (49.6%) of all adult current everyday smokers in New York State attempted to quit for one day or more in 2001 (Figure 5). This proportion is unchanged from that of the previous year (50.4%). The 2001 quit attempt rate for New York City (50.8%) was lower than for 2000 (61.9%). The 2001 quit rate for smokers did not differ significantly by gender or ethnicity (Figure 6).
More than 30% of smokers and recent quitters statewide have used nicotine-replacement products such as nicotine gum, patches, or inhalers, or pharmaceuticals such as Zyban or Wellbutrin to assist in cessation. The use of nicotine replacement products was reported by 22.7% of New York City smokers including recent quitters, and 33.9% of smokers and recent quitters in the rest of the state. Only 30% of smokers statewide reported insurance coverage for cessation products (Table 6).
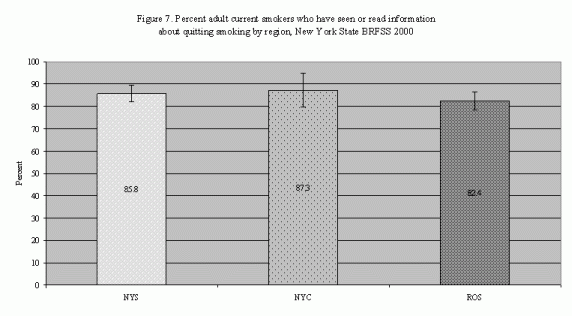
Four out of five New York State smokers recalled having seen or read information about quitting smoking in the past year (Figure 7). The most common sources for this information were television (81.7%), family and friends (73.6%), newspapers or magazines (57.7%), and doctor's offices (53.8%) (Table 7).
| New York State | New York City | Rest of State | |||||||
|---|---|---|---|---|---|---|---|---|---|
| n | % | C.I.* | n | % | C.I.* | n | % | C.I.* | |
| Ever used products to help stop smoking | 570 | 30.6 | 25.2-35.7 | 183 | 22.7 | 15.6-29.8 | 387 | 33.9 | 27.5-40.3 |
| Used self-pay | 164 | 69.5 | 61.0-78.0 | *** | 121 | 72.5 | 63.2-81.8 | ||
| Used insurance or other medical assistance | 164 | 30.5 | 22.0-38.5 | *** | 121 | 27.5 | 18.2-36.8 | ||
* 95% Confidence Interval
***Information not reported due to sample size <50
| New York State | New York City | Rest of State | |||||||
|---|---|---|---|---|---|---|---|---|---|
| n | % | C.I.* | n | % | C.I.* | n | % | C.I.* | |
| Television | 455 | 81.7 | 77.7-85.7 | 148 | 88.1 | 83.1-93.1 | 307 | 78.9 | 73.6-84.2 |
| Radio | 459 | 55.4 | 49.8-61.0 | 149 | 50.1 | 40.9-59.3 | 310 | 57.6 | 50.8-64.4 |
| Billboard | 458 | 46.6 | 40.9-52.3 | 149 | 54.1 | 44.9-63.3 | 309 | 43.4 | 36.4-50.4 |
| Doctor | 458 | 53.8 | 48.0-59.6 | 149 | 55.5 | 46.3-64.7 | 309 | 53.1 | 45.8-60.4 |
| Dentist | 457 | 15.6 | 11.8-19.4 | 148 | 23.6 | 19.5-27.7 | 309 | 12.2 | 8.1-16.3 |
| Other health care professional | 458 | 22.0 | 17.7-26.3 | 149 | 20.0 | 12.7-27.3 | 309 | 22.9 | 17.6-28.2 |
| Work | 458 | 29.6 | 24.7-34.5 | 149 | 34.9 | 25.8-44.0 | 309 | 27.3 | 21.6-33.0 |
| Family or friend | 457 | 73.6 | 68.8-78.4 | 148 | 76.1 | 66.1-84.1 | 309 | 72.6 | 66.7-78.5 |
| Newspaper or magazine | 455 | 57.7 | 51.8-63.6 | 148 | 66.5 | 58.0-75.0 | 307 | 53.9 | 46.5-61.3 |
| Brochure or other printed material | 455 | 53.4 | 47.7-69.1 | 146 | 54.1 | 44.9-63.3 | 309 | 54.1 | 44.1-63.1 |
| Internet | 456 | 13.1 | 9.5-16.7 | 147 | 18.6 | 10.8-26.4 | 309 | 10.7 | 7.0-14.4 |
* 95% Confidence Interval
Exposure to Second-hand Smoke
Each year, second-hand smoke causes an estimated 3,000 lung-cancer deaths among non-smokers, and 150,000 to 300,000 lower respiratory tract infections among infants and children under age 18 months. Asthma and other respiratory conditions also can be worsened by tobacco smoke. Exposure to second-hand smoke occurs in homes, worksites and public places. More than 4,000 chemicals have been identified in tobacco smoke of which at least 43 are known to cause cancer in humans and animals.10
Policy, educational, and medical interventions are recommended to reduce second-hand smoke exposure. Policy approaches include enactment of clean indoor air laws, enforcement of restrictions, and the voluntary adoption of worksite restrictions. According to the New York State 2000 BRFSS, approximately 15% of non-smoking adults live in a household with a smoker. About one in four non-smoking adults in New York State live in homes where smoking is allowed in the household (Table 8). Among adults who work indoors most of the time, approximately 80% indicated their worksite does not allow smoking in either public or work areas (Tables 9-10).
| New York State | New York City | Rest of State | ||||||||
|---|---|---|---|---|---|---|---|---|---|---|
| n | % | C.I.* | n | % | C.I.* | n | % | C.I.* | ||
| No one is allowed to smoke anywhere | Smoker | 470 | 28.6 | 23.8-33.4 | 151 | 25.4 | 17.3-8.1 | 319 | 30.1 | 24.1-36.1 |
| Non-smoker | 1,545 | 73.7 | 71.7-76.3 | 532 | 75.8 | 71.5-80.1 | 1,013 | 72.5 | 69.2-75.8 | |
| Smoking is allowed in some places | Smoker | 470 | 33.8 | 28.9-38.7 | 151 | 37.2 | 28.1-46.3 | 319 | 32.3 | 26.5-38.1 |
| Non-smoker | 1,545 | 15.2 | 13.1-17.3 | 532 | 14.6 | 11.1-18.1 | 1,013 | 15.6 | 13.0-18.2 | |
| Smoking is permitted anywhere | Smoker | 470 | 37.5 | 32.5-42.5 | 151 | 37.4 | 28.3-46.5 | 319 | 37.6 | 31.6-43.6 |
| Non-smoker | 1,545 | 11.1 | 9.3-12.9 | 532 | 9.5 | 6.7-12.3 | 1,013 | 11.9 | 9.6-14.2 | |
* 95% Confidence Interval
| New York State | New York City | Rest of State | |||||||
|---|---|---|---|---|---|---|---|---|---|
| n | % | C.I.* | n | % | C.I.* | n | % | C.I.* | |
| Not allowed in any public areas | 1,257 | 78.7 | 76.1-81.3 | 452 | 80.4 | 76.1-84.7 | 805 | 77.7 | 74.4-81.0 |
| Allowed in some public areas | 1,257 | 14.5 | 12.2-16.8 | 452 | 13.2 | 9.5-16.9 | 805 | 15.3 | 12.4-18.2 |
| Allowed in all public areas | 1,257 | 1.2 | 0.5-1.9 | 452 | 1.7 | 0.7-2.7 | 805 | 0.4 | -0.1-0.9 |
| No official policy | 1,257 | 5.6 | 4.1-7.1 | 452 | 6.0 | 3.5-8.5 | 805 | 5.4 | 3.6-7.2 |
* 95% Confidence Interval
| New York State | New York City | Rest of State | |||||||
|---|---|---|---|---|---|---|---|---|---|
| n | % | C.I.* | n | % | C.I.* | n | %t | C.I.* | |
| Not allowed in work areas | 1,253 | 83.7 | 81.3-86.1 | 451 | 85.6 | 81.9-89.3 | 802 | 82.6 | 79.5-85.7 |
| Allowed in some work areas | 1,253 | 10.1 | 8.1-12.1 | 451 | 8.4 | 5.4-114 | 802 | 11.1 | 8.5-13.7 |
| Allowed in all work areas | 1,253 | 1.8 | 0.9-2.7 | 451 | 1.4 | 0.2-2.6 | 802 | 2.1 | 0.9-3.3 |
| No official policy | 1,253 | 4.4 | 3.1-5.7 | 451 | 4.6 | 2.4-6.8 | 802 | 4.2 | 2.7-5.7 |
* 95% Confidence Interval
References
- Centers for Disease Control and Prevention. Smoking-Attributable Mortality, Morbidity, and Economic Costs (SAMMEC): Adult SAMMEC and Maternal and Child Health (MCH) SAMMEC software. Available at http://www.cdc.gov/tobacco/sammec.
- Remington PL, Smith MY, Williamson DF, Anda RF, Gentry EM, Hogelin GC. Design, characteristics, and usefulness of state-based behavioral risk factor surveillance: 1981-87. Public Health Rep 1988; 103: 366-75.
- Centers for Disease Control and Prevention. Best Practices for Comprehensive Tobacco Control Programs-August 1999. Atlanta: Centers for Disease Control and Prevention, National Center for Chronic Disease Prevention and Health Promotion, Office on Smoking and Health, 1999.
- NYS Department of Health. County Level Prevalence Estimates: New York State Behavioral Risk Factor Surveillance System. NYS Department of Health, Division of Chronic Disease Prevention and Adult Health, Bureau of Chronic Disease Epidemiology and Surveillance, Chronic Disease and Risk Factor Surveillance Unit, 2000.
- Shah, BV, Barnwell, BB, Bieler, GS. SUDAAN Software for the Statistical Analysis of Correlated Data, User's Manual, release 7.0 1996. Research Triangle Park, North Carolina, 1996.
- US Department of Health and Human Services. Healthy People 2010: National Health Promotion and Disease Prevention Objectives. Washington: US Department of Health and Human Services, Public Health Service, 2000.
- Division of Adult and Community Health, National Center for Chronic Disease Prevention and Health Promotion, Centers for Disease Control and Prevention, Behavioral Risk Factor Surveillance System Summary Report 2001.
- Centers for Disease Control and Prevention, BRFSS Summary Prevalence Report 2001.
- Fiore MC, Bailey WC, Bennet G et al. Treating Tobacco Use and Dependence. Clinical Practice Guideline. Rockville (MD): U.S. Department of Health and Human Services, Public Health Service, 2000.
- U.S. Department of Health and Human Services. Reducing the Health Consequences of Smoking: 25 Years of Progress. A Report of the Surgeon General. U.S. Department of Health and Human Services, Public Health Service, Centers for Disease Control, Center for Chronic Disease Prevention and Health Promotion, Office on Smoking and Health, 1989. DHHS Publication No. (CDC) 89-8411.
